
Medtronic reports third quarter fiscal 2022 financial results
Company advanced its pipeline, launched new products, won share, and delivered earnings growth despite COVID-19 impact on healthcare procedure volumes DUBLIN, Feb. 22, 2022 /PRNewswire/ --...
Company advanced its pipeline, launched new products, won share, and delivered earnings growth despite COVID-19 impact on healthcare procedure volumes
DUBLIN, Feb. 22, 2022 /PRNewswire/ -- Medtronic plc (NYSE: MDT) today announced financial results for its third quarter of fiscal year 2022, which ended January 28, 2022.
Key Highlights
- Revenue of $7.8 billion was flat year-over-year as reported and grew 2% organic
- GAAP diluted EPS of $1.10 grew 17%; non-GAAP diluted EPS of $1.37 grew 6%
- Company issues Q4 revenue and EPS guidance
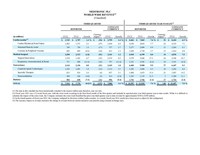
The company reported third quarter worldwide revenue of $7.763 billion, flat year-over-year as reported and an increase of 2% on an organic basis, which excludes the $137 million negative impact of foreign currency translation. Unless otherwise stated, all revenue growth rates in this press release are stated on an organic basis, which excludes the impact of foreign currency translation. The company's third quarter revenue results reflect the unfavorable market impact of COVID-19 and health system labor shortages on medical device procedure volumes, primarily in the U.S.
As reported, third quarter GAAP net income and diluted earnings per share (EPS) were $1.480 billion and $1.10, respectively, both increases of 17%. As detailed in the financial schedules included at the end of this release, third quarter non-GAAP net income and non-GAAP diluted EPS were $1.846 billion and $1.37, respectively, increases of 5% and 6%, respectively.
Third quarter U.S. revenue of $3.939 billion represented 51% of company revenue and was flat year-over-year. Non-U.S. developed market revenue of $2.438 billion represented 31% of company revenue and decreased 3% as reported and increased 1% organic. Emerging Markets revenue of $1.385 billion represented 18% of company revenue and increased 5% as reported and 7% organic.
"We continue to transform Medtronic, advancing our pipeline, launching new products, and winning share. The impact of the COVID-19 resurgence on healthcare procedure volumes, particularly in the United States, peaked in the final weeks of our quarter in January, causing our revenue to fall short of our expectations," said Geoff Martha, Medtronic chairman and chief executive officer. "We expect healthcare procedures to reaccelerate post-Omicron, and our commitment to durable and higher growth remains steadfast."
Cardiovascular Portfolio
The Cardiovascular Portfolio includes the Cardiac Rhythm & Heart Failure (CRHF), Structural Heart & Aortic (SHA), and Coronary & Peripheral Vascular (CPV) divisions. Cardiovascular revenue of $2.745 billion increased 1% as reported and 3% organic, driven by mid-single digit organic growth in CRHF and SHA and low-single digit organic growth in CPV.
- Cardiac Rhythm & Heart Failure revenue of $1.402 billion increased 2% as reported and 4% organic. Adjusting for the discontinuation of HVAD™ System sales, CRHF revenue increased 7% organic. Cardiac Rhythm Management revenue increased in the high-single digits, with low-single digit growth in Defibrillation Solutions and high-single digit growth in Cardiac Pacing Therapies, including high-twenties growth in Leadless Pacemakers on the continued global adoption of Micra™ transcatheter pacing systems. Cardiovascular Diagnostics revenue grew in the low-single digits, as market procedure volumes were affected by COVID-19 resurgence. Cardiac Ablation Solutions revenue increased in the high-single digits on the continued adoption of Arctic Front Advance™ cryoballoon catheters and consoles.
- Structural Heart & Aortic revenue of $740 million increased 1% as reported and 4% organic. Structural Heart grew in the mid-teens, including mid-teens growth in transcatheter aortic valves (TAVR). Aortic declined in the mid-twenties, as a result of supply challenges and the impact of the COVID-19 resurgence on procedure volumes. Cardiac Surgery increased in the low-double digits, driven by strength in extracorporeal life support products.
- Coronary & Peripheral Vascular revenue of $603 million was flat year-over-year as reported and increased 1% organic. Coronary & Renal Denervation (CRDN) decreased in the mid-single digits, given the impact of COVID-19 on percutaneous coronary intervention (PCI) procedures. Peripheral Vascular Health increased in the low-double digits, including low-twenties endoVenous growth on strong sales of the VenaSeal™ closure system and the Abre™ deep venous stent.
Medical Surgical Portfolio
The Medical Surgical Portfolio includes the Surgical Innovations (SI) and the Respiratory, Gastrointestinal & Renal (RGR) divisions. Medical Surgical revenue of $2.290 billion decreased 1% as reported and increased 1% organic, with high-single digit organic growth in SI offset by low double-digit organic declines in RGR. Excluding the impact of ventilator sales given the increased COVID-19 related demand in the prior year, Medical Surgical revenue increased 6% organic.
- Surgical Innovations revenue of $1.519 billion increased 7% as reported and 9% organic. The division had high-single digit growth in Advanced Surgical Instruments, driven by the continued adoption of the company's LigaSure™ and Sonicision™ vessel sealing and dissection technologies, and Tri-Staple™ reinforced reloads. Hernia & Wound Management increased in the low-twenties, with strength in sutures.
- Respiratory, Gastrointestinal & Renal revenue of $771 million decreased 13% as reported and 12% organic. Excluding the impact of ventilator sales, RGR revenue was flat year-over-year organic. Respiratory Interventions decreased in the mid-thirties, with sales of ventilators declining in the high-fifties as demand returns to pre-pandemic levels. Patient Monitoring was flat year-over-year, with mid-single digit growth in both Nellcor™ pulse oximetry products and Perioperative Complications products offset by mid-twenties declines in Respiratory Compromise solutions. Gastrointestinal revenue increased in the mid-single digits, driven by strong sales of ManoScan™ manometry systems and Emprint™ ablation systems. Renal Care Solutions increased in the mid-single digits with strength in acute therapies and renal access products.
Neuroscience Portfolio
The Neuroscience Portfolio includes the Cranial & Spinal Technologies (CST), Specialty Therapies, and Neuromodulation divisions. Neuroscience revenue of $2.144 billion increased 1% as reported and 2% organic, with low-single digit growth in CST and Specialty Therapies, partially offset by low-single digit declines in Neuromodulation, all on an organic basis.
- Cranial & Spinal Technologies revenue of $1.102 billion increased 2% as reported and 3% organic. Spine & Biologics increased in the high-single digits, driven by mid-teens growth in Biologics and mid-single digit Core Spine growth in the U.S. and non-U.S. developed markets. Neurosurgery was flat year-over-year, as declines due to a difficult comparison from strong capital equipment sales in the third quarter of the prior year offset growth in powered surgical instruments, advanced energy products, and CSF management.
- Specialty Therapies revenue of $633 million increased 2% as reported and 3% organic. Neurovascular increased in the low double-digits, with high-teens growth in hemorrhagic stroke products. Pelvic Health decreased in the mid-single digits, as procedure volumes were affected by the COVID-19 resurgence. ENT declined in the low single-digits as a result of supply chain disruptions.
- Neuromodulation revenue of $409 million decreased 4% as reported and 3% organic. Brain Modulation increased in the mid-teens, driven by the continued adoption of the Percept™ PC deep brain stimulation (DBS) system and SenSight™ directional DBS lead system. Pain Therapies declined in the low-double digits, with high-teens declines in Targeted Drug Delivery and mid-single digit declines in Pain Stim given ongoing market pressure on procedures due to COVID-19. At the same time, the company continued to win share in Pain Stim on strong adoption of its Vanta™ and Intellis™ with DTM™ SCS neurostimulators. Interventional declined in the low-single digits given the impact of COVID-19 on procedure volumes.
Diabetes
Diabetes revenue of $584 million decreased 7% as reported and 5% organic, with high-teens declines in the U.S. partially offset by mid-single digit growth in international markets. International growth was driven by low-double digit growth in sales of continuous glucose monitoring (CGM) products, mid-single digit growth in consumable sales, and flat results year-over-year in sales of durable insulin pumps.
Guidance
The company today issued its fiscal year 2022 fourth quarter revenue growth and EPS guidance.
The company expects fourth quarter organic revenue growth of approximately 5.5%, in line with current fourth quarter organic revenue growth Street consensus. If recent foreign currency exchange rates hold, fourth quarter revenue would be negatively affected by approximately $185 million.
The company expects fourth quarter non-GAAP EPS in the range of $1.56 to $1.58, which includes a neutral to slightly positive impact from foreign currency based on recent rates.
"Despite the challenges created by the pandemic, our teams executed and delivered adjusted EPS in-line with our guidance and a penny ahead of consensus," said Karen Parkhill, Medtronic chief financial officer. "We are starting to see procedure volumes improve, and our outlook assumes continued recovery through March and April. By the time we exit the fourth quarter, we expect procedure volumes in most of our markets to be back to pre-COVID levels."
Webcast Information
Medtronic will host a webcast today, February 22, at 8:00 a.m. EST (7:00 a.m. CST) to provide information about its businesses for the public, investors, analysts, and news media. This webcast can be accessed by clicking on the Investor Events link at investorrelations.medtronic.com and this earnings release will be archived at news.medtronic.com. Medtronic will be live tweeting during the webcast on its Newsroom Twitter account, @Medtronic. Within 24 hours of the webcast, a replay of the webcast and transcript of the company's prepared remarks will be available by clicking on the Investor Events link at investorrelations.medtronic.com.
Medtronic plans to report its fourth quarter and full fiscal year 2022 results on Thursday, May 26, 2022. For fiscal year 2023, Medtronic plans to report its first, second, third, and fourth quarter results on Tuesday, August 23, 2022, November 22, 2022, February 21, 2023, and Thursday, May 25, 2023, respectively. Confirmation and additional details will be provided closer to the specific event.
Financial Schedules
The third quarter financial schedules and non-GAAP reconciliations can be viewed by clicking on the Investor Events link at investorrelations.medtronic.com. To view a printable PDF of the financial schedules and non-GAAP reconciliations, click here. To view the third quarter earnings presentation, click here.
|
MEDTRONIC PLC |
||||||||||||||||||||||||
|
WORLD WIDE REVENUE(1) |
||||||||||||||||||||||||
|
(Unaudited) |
||||||||||||||||||||||||
|
THIRD QUARTER |
THIRD QUARTER YEAR-TO-DATE(2) |
|||||||||||||||||||||||
|
REPORTED |
CONSTANT CURRENCY |
REPORTED |
CONSTANT CURRENCY |
|||||||||||||||||||||
|
(in millions) |
FY22 |
FY21 |
Growth |
Currency Impact(4) |
FY22 |
Growth |
FY22 |
FY21 |
Growth |
Currency Impact(4) |
FY22 |
Growth |
||||||||||||
|
Cardiovascular(3) |
$ 2,745 |
$ 2,707 |
1.4 % |
$ (54) |
$ 2,799 |
3.4 % |
$ 8,462 |
$ 7,865 |
7.6 % |
$ 52 |
$ 8,410 |
6.9 % |
||||||||||||
|
Cardiac Rhythm & Heart Failure |
1,402 |
1,371 |
2.3 |
(27) |
1,429 |
4.2 |
4,356 |
4,045 |
7.7 |
24 |
4,332 |
7.1 |
||||||||||||
|
Structural Heart & Aortic |
740 |
730 |
1.4 |
(17) |
757 |
3.7 |
2,277 |
2,090 |
8.9 |
13 |
2,264 |
8.3 |
||||||||||||
|
Coronary & Peripheral Vascular |
603 |
605 |
(0.3) |
(10) |
613 |
1.3 |
1,829 |
1,730 |
5.7 |
15 |
1,814 |
4.9 |
||||||||||||
|
Medical Surgical |
2,290 |
2,313 |
(1.0) |
(51) |
2,341 |
1.2 |
6,910 |
6,399 |
8.0 |
34 |
6,876 |
7.5 |
||||||||||||
|
Surgical Innovations |
1,519 |
1,423 |
6.7 |
(35) |
1,554 |
9.2 |
4,570 |
3,896 |
17.3 |
24 |
4,546 |
16.7 |
||||||||||||
|
Respiratory, Gastrointestinal, & Renal |
771 |
890 |
(13.4) |
(16) |
787 |
(11.6) |
2,341 |
2,502 |
(6.4) |
10 |
2,331 |
(6.8) |
||||||||||||
|
Neuroscience |
2,144 |
2,126 |
0.8 |
(21) |
2,165 |
1.8 |
6,484 |
5,900 |
9.9 |
37 |
6,447 |
9.3 |
||||||||||||
|
Cranial & Spinal Technologies |
1,102 |
1,081 |
1.9 |
(12) |
1,114 |
3.1 |
3,292 |
3,096 |
6.3 |
10 |
3,282 |
6.0 |
||||||||||||
|
Specialty Therapies |
633 |
618 |
2.4 |
(4) |
637 |
3.1 |
1,908 |
1,653 |
15.4 |
21 |
1,887 |
14.2 |
||||||||||||
|
Neuromodulation |
409 |
426 |
(4.0) |
(5) |
414 |
(2.8) |
1,285 |
1,152 |
11.5 |
5 |
1,280 |
11.1 |
||||||||||||
|
Diabetes |
584 |
630 |
(7.3) |
(12) |
596 |
(5.4) |
1,741 |
1,766 |
(1.4) |
17 |
1,724 |
(2.4) |
||||||||||||
|
TOTAL |
$ 7,763 |
$ 7,775 |
(0.2) % |
$ (137) |
$ 7,900 |
1.6 % |
$ 23,597 |
$ 21,929 |
7.6 % |
$ 140 |
$ 23,457 |
7.0 % |
||||||||||||
|
(1) The data in this schedule has been intentionally rounded to the nearest million and, therefore, may not sum. |
|
(2) Fiscal year 2021 was a 53-week fiscal year, with the extra week occurring in the first fiscal month of the first quarter and included in reported prior year third quarter year-to-date results. While it is difficult to calculate the impact of the extra week, the Company estimates the extra week benefited the prior year third quarter year-to-date revenue by approximately $360 to $390 million. |
|
(3) In the fourth quarter of fiscal year 2021, the Company realigned its divisions within Cardiovascular. As a result, fiscal year 2021 results have been recast to adjust for this realignment. |
|
(4) The currency impact to revenue measures the change in revenue between current and prior year periods using constant exchange rates. |
|
MEDTRONIC PLC |
||||||||||||
|
U.S.(1)(2) REVENUE |
||||||||||||
|
(Unaudited) |
||||||||||||
|
THIRD QUARTER |
THIRD QUARTER YEAR-TO-DATE |
|||||||||||
|
REPORTED |
REPORTED |
|||||||||||
|
(in millions) |
FY22 |
FY21 |
Growth |
FY22 |
FY21 |
Growth |
||||||
|
Cardiovascular(3) |
$ 1,297 |
$ 1,272 |
2.0 % |
$ 4,090 |
$ 3,854 |
6.1 % |
||||||
|
Cardiac Rhythm & Heart Failure |
708 |
701 |
1.0 |
2,238 |
2,132 |
5.0 |
||||||
|
Structural Heart & Aortic |
312 |
304 |
2.6 |
986 |
906 |
8.8 |
||||||
|
Coronary & Peripheral Vascular |
278 |
267 |
4.1 |
866 |
816 |
6.1 |
||||||
|
Medical Surgical |
990 |
959 |
3.2 |
2,950 |
2,677 |
10.2 |
||||||
|
Surgical Innovations |
609 |
538 |
13.2 |
1,779 |
1,498 |
18.8 |
||||||
|
Respiratory, Gastrointestinal, & Renal |
381 |
421 |
(9.5) |
1,171 |
1,179 |
(0.7) |
||||||
|
Neuroscience |
1,397 |
1,401 |
(0.3) |
4,237 |
3,934 |
7.7 |
||||||
|
Cranial & Spinal Technologies |
784 |
756 |
3.7 |
2,328 |
2,218 |
5.0 |
||||||
|
Specialty Therapies |
343 |
353 |
(2.8) |
1,057 |
940 |
12.4 |
||||||
|
Neuromodulation |
270 |
293 |
(7.8) |
852 |
776 |
9.8 |
||||||
|
Diabetes |
255 |
307 |
(16.9) |
760 |
879 |
(13.5) |
||||||
|
TOTAL |
$ 3,939 |
$ 3,939 |
— % |
$ 12,038 |
$ 11,344 |
6.1 % |
||||||
|
(1) U.S. includes the United States and U.S. territories. |
|
(2) The data in this schedule has been intentionally rounded to the nearest million and, therefore, may not sum. |
|
(3) In the fourth quarter of fiscal year 2021, the Company realigned its divisions within Cardiovascular. As a result, fiscal year 2021 results have been recast to adjust for this realignment. |
|
MEDTRONIC PLC |
||||||||||||||||||||||||
|
WORLD WIDE REVENUE: GEOGRAPHIC (1)(2) |
||||||||||||||||||||||||
|
(Unaudited) |
||||||||||||||||||||||||
|
THIRD QUARTER |
THIRD QUARTER YEAR-TO-DATE(3) |
|||||||||||||||||||||||
|
REPORTED |
CONSTANT CURRENCY |
REPORTED |
CONSTANT CURRENCY |
|||||||||||||||||||||
|
(in millions) |
FY22 |
FY21 |
Growth |
Currency Impact(4) |
FY22 |
Growth |
FY22 |
FY21 |
Growth |
Currency Impact(4) |
FY22 |
Growth |
||||||||||||
|
U.S. |
$ 1,297 |
$ 1,272 |
2.0 % |
$ — |
$ 1,297 |
2.0 % |
$ 4,090 |
$ 3,854 |
6.1 % |
$ — |
$ 4,090 |
6.1 % |
||||||||||||
|
Non-U.S. Developed |
935 |
941 |
(0.6) |
(45) |
980 |
4.1 |
2,886 |
2,739 |
5.4 |
25 |
2,861 |
4.5 |
||||||||||||
|
Emerging Markets |
513 |
493 |
4.1 |
(9) |
522 |
5.9 |
1,486 |
1,271 |
16.9 |
27 |
1,459 |
14.8 |
||||||||||||
|
Cardiovascular |
2,745 |
2,707 |
1.4 |
(54) |
2,799 |
3.4 |
8,462 |
7,865 |
7.6 |
52 |
8,410 |
6.9 |
||||||||||||
|
U.S. |
990 |
959 |
3.2 |
— |
990 |
3.2 |
2,950 |
2,677 |
10.2 |
— |
2,950 |
10.2 |
||||||||||||
|
Non-U.S. Developed |
812 |
868 |
(6.5) |
(38) |
850 |
(2.1) |
2,521 |
2,425 |
4.0 |
16 |
2,505 |
3.3 |
||||||||||||
|
Emerging Markets |
488 |
486 |
0.4 |
(12) |
500 |
2.9 |
1,439 |
1,297 |
10.9 |
18 |
1,421 |
9.6 |
||||||||||||
|
Medical Surgical |
2,290 |
2,313 |
(1.0) |
(51) |
2,341 |
1.2 |
6,910 |
6,399 |
8.0 |
34 |
6,876 |
7.5 |
||||||||||||
|
U.S. |
1,397 |
1,401 |
(0.3) |
— |
1,397 |
(0.3) |
4,237 |
3,934 |
7.7 |
— |
4,237 |
7.7 |
||||||||||||
|
Non-U.S. Developed |
431 |
444 |
(2.9) |
(22) |
453 |
2.0 |
1,330 |
1,246 |
6.7 |
7 |
1,323 |
6.2 |
||||||||||||
|
Emerging Markets |
316 |
280 |
12.9 |
1 |
315 |
12.5 |
918 |
720 |
27.5 |
30 |
888 |
23.3 |
||||||||||||
|
Neuroscience |
2,144 |
2,126 |
0.8 |
(21) |
2,165 |
1.8 |
6,484 |
5,900 |
9.9 |
37 |
6,447 |
9.3 |
||||||||||||
|
U.S. |
255 |
307 |
(16.9) |
— |
255 |
(16.9) |
760 |
879 |
(13.5) |
— |
760 |
(13.5) |
||||||||||||
|
Non-U.S. Developed |
261 |
268 |
(2.6) |
(10) |
271 |
1.1 |
780 |
733 |
6.4 |
15 |
765 |
4.4 |
||||||||||||
|
Emerging Markets |
68 |
55 |
23.6 |
(1) |
69 |
25.5 |
201 |
154 |
30.5 |
3 |
198 |
28.6 |
||||||||||||
|
Diabetes |
584 |
630 |
(7.3) |
(12) |
596 |
(5.4) |
1,741 |
1,766 |
(1.4) |
17 |
1,724 |
(2.4) |
||||||||||||
|
U.S. |
3,939 |
3,939 |
— |
— |
3,939 |
— |
12,038 |
11,344 |
6.1 |
— |
12,038 |
6.1 |
||||||||||||
|
Non-U.S. Developed |
2,438 |
2,522 |
(3.3) |
(115) |
2,553 |
1.2 |
7,517 |
7,143 |
5.2 |
62 |
7,455 |
4.4 |
||||||||||||
|
Emerging Markets |
1,385 |
1,314 |
5.4 |
(22) |
1,407 |
7.1 |
4,043 |
3,443 |
17.4 |
78 |
3,965 |
15.2 |
||||||||||||
|
TOTAL |
$ 7,763 |
$ 7,775 |
(0.2) % |
$ (137) |
$ 7,900 |
1.6 % |
$ 23,597 |
$ 21,929 |
7.6 % |
$ 140 |
$ 23,457 |
7.0 % |
||||||||||||
|
(1) U.S. includes the United States and U.S. territories. Non-U.S. developed markets include Japan, Australia, New Zealand, Korea, Canada, and the countries of Western Europe. Emerging Markets include the countries of the Middle East, Africa, Latin America, Eastern Europe, and the countries of Asia that are not included in the non-U.S. developed markets, as previously defined. |
|
(2) The data in this schedule has been intentionally rounded to the nearest million and, therefore, may not sum. |
|
(3) Fiscal year 2021 was a 53-week fiscal year, with the extra week occurring in the first fiscal month of the first quarter and included in reported prior year third quarter year-to-date results. While it is difficult to calculate the impact of the extra week, the Company estimates the extra week benefited the prior year third quarter year-to-date revenue by approximately $360 to $390 million. |
|
(4) The currency impact to revenue measures the change in revenue between current and prior year periods using constant exchange rates. |
|
MEDTRONIC PLC |
|||||||
|
CONSOLIDATED STATEMENTS OF INCOME |
|||||||
|
(Unaudited) |
|||||||
|
Three months ended |
Nine months ended |
||||||
|
(in millions, except per share data) |
January 28, 2022 |
January 29, 2021 |
January 28, 2022 |
January 29, 2021 |
|||
|
Net sales |
$ 7,763 |
$ 7,775 |
$ 23,597 |
$ 21,929 |
|||
|
Costs and expenses: |
|||||||
|
Cost of products sold |
2,459 |
2,621 |
7,554 |
7,830 |
|||
|
Research and development expense |
668 |
601 |
2,094 |
1,861 |
|||
|
Selling, general, and administrative expense |
2,561 |
2,537 |
7,723 |
7,553 |
|||
|
Amortization of intangible assets |
432 |
453 |
1,298 |
1,337 |
|||
|
Restructuring charges, net |
12 |
83 |
32 |
235 |
|||
|
Certain litigation charges, net |
35 |
122 |
95 |
118 |
|||
|
Other operating (income) expense, net |
(63) |
82 |
719 |
116 |
|||
|
Operating profit |
1,659 |
1,277 |
4,081 |
2,879 |
|||
|
Other non-operating income, net |
(67) |
(86) |
(244) |
(233) |
|||
|
Interest expense |
137 |
143 |
410 |
783 |
|||
|
Income before income taxes |
1,589 |
1,220 |
3,915 |
2,329 |
|||
|
Income tax provision (benefit) |
106 |
(59) |
346 |
65 |
|||
|
Net income |
1,483 |
1,279 |
3,570 |
2,264 |
|||
|
Net income attributable to noncontrolling interests |
(4) |
(9) |
(16) |
(18) |
|||
|
Net income attributable to Medtronic |
$ 1,480 |
$ 1,270 |
$ 3,554 |
$ 2,246 |
|||
|
Basic earnings per share |
$ 1.10 |
$ 0.94 |
$ 2.64 |
$ 1.67 |
|||
|
Diluted earnings per share |
$ 1.10 |
$ 0.94 |
$ 2.63 |
$ 1.66 |
|||
|
Basic weighted average shares outstanding |
1,343.7 |
1,346.4 |
1,344.4 |
1,344.2 |
|||
|
Diluted weighted average shares outstanding |
1,350.3 |
1,356.0 |
1,353.9 |
1,352.7 |
|||
|
The data in this schedule has been intentionally rounded to the nearest million, and, therefore, may not sum. |
|
MEDTRONIC PLC |
|||||||||||||||||
|
GAAP TO NON-GAAP RECONCILIATIONS(1) |
|||||||||||||||||
|
(Unaudited) |
|||||||||||||||||
|
Three months ended January 28, 2022 |
|||||||||||||||||
|
(in millions, except per share data) |
Net Sales |
Cost of Products Sold |
Gross Margin Percent |
Operating Profit |
Operating Profit Percent |
Income Before Income Taxes |
Net Income Attributable to Medtronic |
Diluted EPS |
Effective Tax Rate |
||||||||
|
GAAP |
$ 7,763 |
$ 2,459 |
68.3 % |
$ 1,659 |
21.4 % |
$ 1,589 |
$ 1,480 |
$ 1.10 |
6.7 % |
||||||||
|
Non-GAAP Adjustments: |
|||||||||||||||||
|
Restructuring and associated costs (2) |
— |
(27) |
0.3 |
78 |
1.0 |
78 |
63 |
0.05 |
19.2 |
||||||||
|
Acquisition-related items (3) |
— |
(4) |
0.1 |
(50) |
(0.6) |
(50) |
(51) |
(0.04) |
(4.0) |
||||||||
|
Certain litigation charges |
— |
— |
— |
35 |
0.5 |
35 |
27 |
0.02 |
25.7 |
||||||||
|
(Gain)/loss on minority investments (4) |
— |
— |
— |
— |
— |
2 |
3 |
— |
(50.0) |
||||||||
|
Medical device regulations (5) |
— |
(13) |
0.2 |
25 |
0.3 |
25 |
20 |
0.01 |
20.0 |
||||||||
|
Amortization of intangible assets |
— |
— |
— |
432 |
5.6 |
432 |
365 |
0.27 |
15.5 |
||||||||
|
Certain tax adjustments, net (6) |
— |
— |
— |
— |
— |
— |
(59) |
(0.04) |
— |
||||||||
|
Non-GAAP |
$ 7,763 |
$ 2,415 |
68.9 % |
$ 2,181 |
28.1 % |
$ 2,112 |
$ 1,846 |
$ 1.37 |
12.4 % |
||||||||
|
Currency impact |
137 |
86 |
(0.6) |
(43) |
(1.0) |
(0.03) |
|||||||||||
|
Currency Adjusted |
$ 7,900 |
$ 2,501 |
68.3 % |
$ 2,138 |
27.1 % |
$ 1.34 |
|||||||||||
|
Three months ended January 29, 2021 |
|||||||||||||||||
|
(in millions, except per share data) |
Net Sales |
Cost of Products Sold |
Gross Margin Percent |
Operating Profit |
Operating Profit Percent |
Income Before Income Taxes |
Net Income Attributable to Medtronic |
Diluted EPS |
Effective Tax Rate |
||||||||
|
GAAP |
$ 7,775 |
$ 2,621 |
66.3 % |
$ 1,277 |
16.4 % |
$ 1,220 |
$ 1,270 |
$ 0.94 |
(4.8) % |
||||||||
|
Non-GAAP Adjustments: |
|||||||||||||||||
|
Restructuring and associated costs (2) |
— |
(36) |
0.5 |
160 |
2.1 |
160 |
117 |
0.09 |
26.9 |
||||||||
|
Acquisition-related items (3) |
— |
(5) |
0.1 |
35 |
0.5 |
35 |
32 |
0.02 |
8.6 |
||||||||
|
Certain litigation charges |
— |
— |
— |
122 |
1.6 |
122 |
101 |
0.07 |
17.2 |
||||||||
|
(Gain)/loss on minority investments (4) |
— |
— |
— |
— |
— |
(18) |
(15) |
(0.01) |
16.7 |
||||||||
|
Medical device regulations (5) |
— |
(11) |
0.1 |
21 |
0.3 |
21 |
17 |
0.01 |
19.0 |
||||||||
|
Amortization of intangible assets |
— |
— |
— |
453 |
5.8 |
453 |
380 |
0.28 |
16.1 |
||||||||
|
Certain tax adjustments, net (6) |
— |
— |
— |
— |
— |
— |
(150) |
(0.11) |
— |
||||||||
|
Non-GAAP |
$ 7,775 |
$ 2,569 |
67.0 % |
$ 2,068 |
26.6 % |
$ 1,993 |
$ 1,753 |
$ 1.29 |
11.7 % |
||||||||
|
See description of non-GAAP financial measures at the end of the earnings press release. |
|
(1) The data in this schedule has been intentionally rounded to the nearest million or $0.01 for EPS figures, and, therefore, may not sum. |
|
(2) Associated costs include costs incurred as a direct result of the restructuring program, such as salaries for employees supporting the program and consulting expenses. |
|
(3) The charges primarily include business combination costs, changes in fair value of contingent consideration, and specifically for the three months ended January 28, 2022, certain license payments for unapproved technology. |
|
(4) We exclude unrealized and realized gains and losses on our minority investments as we do not believe that these components of income or expense have a direct correlation to our ongoing or future business operations. |
|
(5) The charges represent incremental costs of complying with the new European Union (E.U.) medical device regulations for previously registered products and primarily include charges for contractors supporting the project and other direct third-party expenses. |
|
(6) For the three months ended January 28, 2022, the tax benefit primarily relates to the deferred tax impact associated with a step up in tax basis for Swiss Cantonal purposes. For the three months ended January 29, 2021, the tax benefit primarily relates to the finalization of an audit at the IRS Appellate level for fiscal years 2012 through 2014 and the capitalization of certain research and development costs for U.S. income tax purposes. For each period, the tax benefits were partially offset by the amortization on previously established deferred tax assets from intercompany intellectual property transactions. |
|
MEDTRONIC PLC |
|||||||||||||||||
|
GAAP TO NON-GAAP RECONCILIATIONS(1) |
|||||||||||||||||
|
(Unaudited) |
|||||||||||||||||
|
Nine months ended January 28, 2022 |
|||||||||||||||||
|
(in millions, except per share data) |
Net Sales |
Cost of Products Sold |
Gross Margin Percent |
Operating Profit |
Operating Profit Percent |
Income Before Income Taxes |
Net Income attributable to Medtronic |
Diluted EPS |
Effective Tax Rate |
||||||||
|
GAAP |
$ 23,597 |
$ 7,554 |
68.0 % |
$ 4,081 |
17.3 % |
$ 3,915 |
$ 3,554 |
$ 2.63 |
8.8 % |
||||||||
|
Non-GAAP Adjustments: |
|||||||||||||||||
|
Restructuring and associated costs (2) |
— |
(91) |
0.4 |
237 |
1.0 |
237 |
191 |
0.14 |
19.4 |
||||||||
|
Acquisition-related items (3) |
— |
(14) |
0.1 |
46 |
0.2 |
46 |
21 |
0.02 |
56.5 |
||||||||
|
Certain litigation charges |
— |
— |
— |
95 |
0.4 |
95 |
78 |
0.06 |
17.9 |
||||||||
|
(Gain)/loss on minority investments (4) |
— |
— |
— |
— |
— |
(23) |
(19) |
(0.01) |
4.3 |
||||||||
|
Medical device regulations (5) |
— |
(39) |
0.2 |
70 |
0.3 |
70 |
56 |
0.04 |
20.0 |
||||||||
|
Amortization of intangible assets |
— |
— |
— |
1,298 |
5.5 |
1,298 |
1,093 |
0.81 |
15.8 |
||||||||
|
MCS impairments / costs (6) |
— |
(58) |
0.2 |
726 |
3.1 |
726 |
564 |
0.42 |
22.3 |
||||||||
|
Certain tax adjustments, net (7) |
— |
— |
— |
— |
— |
— |
10 |
0.01 |
— |
||||||||
|
Non-GAAP |
$ 23,597 |
$ 7,353 |
68.8 % |
$ 6,554 |
27.8 % |
$ 6,365 |
$ 5,547 |
$ 4.10 |
12.7 % |
||||||||
|
Currency impact |
(140) |
60 |
(0.4) |
(148) |
(0.5) |
(0.09) |
|||||||||||
|
Currency Adjusted |
$ 23,457 |
$ 7,413 |
68.4 % |
$ 6,406 |
27.3 % |
$ 4.01 |
|||||||||||
|
Nine months ended January 29, 2021 |
|||||||||||||||||
|
(in millions, except per share data) |
Net Sales |
Cost of Products Sold |
Gross Margin Percent |
Operating Profit |
Operating Profit Percent |
Income Before Income Taxes |
Net Income attributable to Medtronic |
Diluted EPS |
Effective Tax Rate |
||||||||
|
GAAP |
$ 21,929 |
$ 7,830 |
64.3 % |
$ 2,879 |
13.1 % |
$ 2,329 |
$ 2,246 |
$ 1.66 |
2.8 % |
||||||||
|
Non-GAAP Adjustments: |
|||||||||||||||||
|
Restructuring and associated costs (2) |
— |
(95) |
0.4 |
466 |
2.1 |
466 |
358 |
0.26 |
23.2 |
||||||||
|
Acquisition-related items (3) |
— |
(10) |
— |
(13) |
(0.1) |
(13) |
5 |
— |
138.5 |
||||||||
|
Certain litigation charges |
— |
— |
— |
118 |
0.5 |
118 |
95 |
0.07 |
19.5 |
||||||||
|
(Gain)/loss on minority investments (4) |
— |
— |
— |
— |
— |
(28) |
(23) |
(0.02) |
17.9 |
||||||||
|
Medical device regulations (5) |
— |
(32) |
0.1 |
58 |
0.3 |
58 |
48 |
0.04 |
17.2 |
||||||||
|
Amortization of intangible assets |
— |
— |
— |
1,337 |
6.1 |
1,337 |
1,123 |
0.83 |
16.0 |
||||||||
|
Debt tender premium and other charges (8) |
— |
— |
— |
— |
— |
308 |
248 |
0.18 |
19.5 |
||||||||
|
Certain tax adjustments, net (7) |
— |
— |
— |
— |
— |
— |
(130) |
(0.10) |
— |
||||||||
|
Non-GAAP |
$ 21,929 |
$ 7,694 |
64.9 % |
$ 4,845 |
22.1 % |
$ 4,576 |
$ 3,969 |
$ 2.93 |
13.0 % |
||||||||
|
See description of non-GAAP financial measures contained in this release. |
|
(1)The data in this schedule has been intentionally rounded to the nearest million or $0.01 for EPS figures, and, therefore, may not sum. |
|
(2) Associated costs include costs incurred as a direct result of the restructuring program, such as salaries for employees supporting the program and consulting expenses. |
|
(3) The charges primarily include business combination costs, changes in fair value of contingent consideration, acquisitions of, or certain license payments for, unapproved technology, and specifically for the nine months ended January 29, 2021, changes in amounts accrued for certain contingent liabilities for recent acquisitions. |
|
(4) We exclude unrealized and realized gains and losses on our minority investments as we do not believe that these components of income or expense have a direct correlation to our ongoing or future business operations. |
|
(5) The charges represent incremental costs of complying with the new E.U. medical device regulations for previously registered products and primarily include charges for contractors supporting the project and other direct third-party expenses. |
|
(6) The charges relate to the Company's June 2021 decision to stop the distribution and sale of the Medtronic HVAD System within the Mechanical Circulatory Support Operating Unit (MCS). The charges included $515 million of non-cash impairments, primarily related to $409 million of intangible asset impairments, as well as $211 million for commitments and obligations in connection with the decision, including customer support obligations, restructuring, and other associated costs. Medtronic is committed to serving the needs of the approximately 4,000 patients currently implanted with the HVAD System. |
|
(7) For the nine months ended January 28, 2022, the tax charge primarily relates to the amortization on previously established deferred tax assets from intercompany intellectual property transactions and a charge related to a change in the Company's permanent reinvestment assertion on certain historical earnings, which are partially offset by the deferred tax impact associated with a step up in tax basis for Swiss Cantonal purposes. For the nine months ended January 29, 2021, the tax benefit primarily relates to the finalization of an audit at the IRS Appellate level for fiscal years 2012 through 2014 and the capitalization of certain research and development costs for U.S. income tax purposes which are partially offset by the impact of an intercompany sale of assets and the amortization on previously established deferred tax assets from intercompany intellectual property transactions. |
|
(8) The charges relate to the early redemption of approximately $6.0 billion of debt. |
|
MEDTRONIC PLC |
|||||||||||||||
|
GAAP TO NON-GAAP RECONCILIATIONS(1) |
|||||||||||||||
|
(Unaudited) |
|||||||||||||||
|
Three months ended January 28, 2022 |
|||||||||||||||
|
(in millions) |
Net Sales |
SG&A Expense |
SG&A Expense as a % of Net Sales |
R&D Expense |
R&D Expense as a % of Net Sales |
Other Operating Expense, net |
Other Operating Expense, net as a % of Net Sales |
Other Non-Operating (Income) Expense, net |
|||||||
|
GAAP |
$ 7,763 |
$ 2,561 |
33.0 % |
$ 668 |
8.6 % |
$ (63) |
(0.8) % |
$ (67) |
|||||||
|
Non-GAAP Adjustments: |
|||||||||||||||
|
Restructuring and associated costs (2) |
— |
(39) |
(0.5) |
— |
— |
— |
— |
— |
|||||||
|
Acquisition-related items (3) |
— |
— |
— |
(11) |
(0.1) |
64 |
0.8 |
— |
|||||||
|
Medical device regulations (4) |
— |
— |
— |
(12) |
(0.2) |
— |
— |
— |
|||||||
|
Gain/(loss) on minority investments (5) |
— |
— |
— |
— |
— |
— |
— |
(2) |
|||||||
|
Non-GAAP |
$ 7,763 |
$ 2,521 |
32.5 % |
$ 646 |
8.3 % |
$ — |
— % |
$ (69) |
|||||||
|
Currency impact |
137 |
34 |
(0.2) |
— |
(0.1) |
62 |
0.8 |
(1) |
|||||||
|
Currency Adjusted |
$ 7,900 |
$ 2,555 |
32.3 % |
$ 646 |
8.2 % |
$ 62 |
0.8 % |
$ (70) |
|||||||
|
Nine months ended January 28, 2022 |
|||||||||||||||
|
(in millions) |
Net Sales |
SG&A Expense |
SG&A Expense as a % of Net Sales |
R&D Expense |
R&D Expense as a % of Net Sales |
Other Operating Expense (Income), net |
Other Operating Expense, net as a % of Net Sales |
Other Non-Operating (Income) Expense, net |
|||||||
|
GAAP |
$ 23,597 |
$ 7,723 |
32.7 % |
$ 2,094 |
8.9 % |
$ 719 |
3.0 % |
$ (244) |
|||||||
|
Non-GAAP Adjustments: |
|||||||||||||||
|
Restructuring and associated costs (2) |
— |
(114) |
(0.5) |
— |
— |
— |
— |
— |
|||||||
|
Acquisition-related items (3) |
— |
— |
— |
(101) |
(0.4) |
67 |
0.3 |
— |
|||||||
|
Medical device regulations (4) |
— |
(1) |
— |
(30) |
(0.1) |
— |
— |
— |
|||||||
|
MCS impairment / costs (6) |
— |
— |
— |
— |
— |
(668) |
(2.8) |
— |
|||||||
|
Gain/(loss) on minority investments (5) |
— |
— |
— |
— |
— |
— |
— |
23 |
|||||||
|
Non-GAAP |
$ 23,597 |
$ 7,609 |
32.2 % |
$ 1,964 |
8.3 % |
$ 118 |
0.5 % |
$ (221) |
|||||||
|
Currency impact |
(140) |
(46) |
— |
(9) |
— |
4 |
— |
— |
|||||||
|
Currency Adjusted |
$ 23,457 |
$ 7,563 |
32.2 % |
$ 1,955 |
8.3 % |
$ 122 |
0.5 % |
$ (221) |
|||||||
|
See description of non-GAAP financial measures at the end of the earnings press release. |
|
(1) The data in this schedule has been intentionally rounded to the nearest million, and, therefore, may not sum. |
|
(2) Associated costs include costs incurred as a direct result of the restructuring program, such as salaries for employees supporting the program and consulting expenses. |
|
(3) The charges primarily include business combination costs, changes in fair value of contingent consideration, and acquisitions of, or certain license payments, for unapproved technology. |
|
(4) The charges represent incremental costs of complying with the new E.U. medical device regulations for previously registered products and primarily include charges for contractors supporting the project and other direct third-party expenses. |
|
(5) We exclude unrealized and realized gains and losses on our minority investments as we do not believe that these components of income or expense have a direct correlation to our ongoing or future business operations. |
|
(6) The charges relate to the Company's June 2021 decision to stop the distribution and sale of the Medtronic HVAD System within the Mechanical Circulatory Support Operating Unit (MCS). The charges included $515 million of non-cash impairments, primarily related to $409 million of intangible asset impairments, as well as $211 million for commitments and obligations in connection with the decision, including customer support obligations, restructuring, and other associated costs. Medtronic is committed to serving the needs of the approximately 4,000 patients currently implanted with the HVAD System. |
|
MEDTRONIC PLC |
|||||
|
GAAP TO NON-GAAP RECONCILIATIONS(1) |
|||||
|
(Unaudited) |
|||||
|
Nine months ended |
Nine months ended |
Fiscal year |
|||
|
(in millions) |
January 28, 2022 |
January 29, 2021 |
2021 |
||
|
Net cash provided by operating activities |
$ 5,289 |
$ 4,495 |
$ 6,240 |
||
|
Additions to property, plant, and equipment |
(979) |
(978) |
(1,355) |
||
|
Free Cash Flow (2) |
$ 4,310 |
$ 3,517 |
$ 4,885 |
||
|
See description of non-GAAP financial measures at the end of the earnings press release. |
|
(1) The data in this schedule has been intentionally rounded to the nearest million, and, therefore, may not sum. |
|
(2) Free cash flow represents operating cash flows less property, plant, and equipment additions. |
|
MEDTRONIC PLC |
||||
|
CONSOLIDATED BALANCE SHEETS |
||||
|
(Unaudited) |
||||
|
(in millions) |
January 28, 2022 |
April 30, 2021 |
||
|
ASSETS |
||||
|
Current assets: |
||||
|
Cash and cash equivalents |
$ 3,479 |
$ 3,593 |
||
|
Investments |
7,742 |
7,224 |
||
|
Accounts receivable, less allowances and credit losses of $253 and $241, respectively |
5,446 |
5,462 |
||
|
Inventories, net |
4,514 |
4,313 |
||
|
Other current assets |
2,122 |
1,955 |
||
|
Total current assets |
23,303 |
22,548 |
||
|
Property, plant, and equipment |
13,074 |
12,700 |
||
|
Accumulated depreciation |
(7,823) |
(7,479) |
||
|
Property, plant, and equipment, net |
5,251 |
5,221 |
||
|
Goodwill |
41,346 |
41,961 |
||
|
Other intangible assets, net |
16,078 |
17,740 |
||
|
Tax assets |
3,309 |
3,169 |
||
|
Other assets |
2,517 |
2,443 |
||
|
Total assets |
$ 91,804 |
$ 93,083 |
||
|
LIABILITIES AND EQUITY |
||||
|
Current liabilities: |
||||
|
Current debt obligations |
$ 865 |
$ 11 |
||
|
Accounts payable |
1,985 |
2,106 |
||
|
Accrued compensation |
2,152 |
2,482 |
||
|
Accrued income taxes |
383 |
435 |
||
|
Other accrued expenses |
3,542 |
3,475 |
||
|
Total current liabilities |
8,927 |
8,509 |
||
|
Long-term debt |
24,290 |
26,378 |
||
|
Accrued compensation and retirement benefits |
1,369 |
1,557 |
||
|
Accrued income taxes |
2,115 |
2,251 |
||
|
Deferred tax liabilities |
968 |
1,028 |
||
|
Other liabilities |
1,423 |
1,756 |
||
|
Total liabilities |
39,091 |
41,481 |
||
|
Commitments and contingencies |
||||
|
Shareholders' equity: |
||||
|
Ordinary shares— par value $0.0001, 2.6 billion shares authorized, 1,342,565,589 and 1,345,400,671 shares issued and outstanding, respectively |
— |
— |
||
|
Additional paid-in capital |
25,814 |
26,319 |
||
|
Retained earnings |
29,607 |
28,594 |
||
|
Accumulated other comprehensive loss |
(2,879) |
(3,485) |
||
|
Total shareholders' equity |
52,542 |
51,428 |
||
|
Noncontrolling interests |
171 |
174 |
||
|
Total equity |
52,713 |
51,602 |
||
|
Total liabilities and equity |
$ 91,804 |
$ 93,083 |
||
|
The data in this schedule has been intentionally rounded to the nearest million, and, therefore, may not sum. |
|
MEDTRONIC PLC |
||||
|
CONSOLIDATED STATEMENTS OF CASH FLOWS |
||||
|
(Unaudited) |
||||
|
Nine months ended |
||||
|
(in millions) |
January 28, 2022 |
January 29, 2021 |
||
|
Operating Activities: |
||||
|
Net income |
$ 3,570 |
$ 2,264 |
||
|
Adjustments to reconcile net income to net cash provided by operating activities: |
||||
|
Depreciation and amortization |
2,019 |
2,018 |
||
|
Provision for doubtful accounts |
49 |
103 |
||
|
Deferred income taxes |
(234) |
(208) |
||
|
Stock-based compensation |
287 |
275 |
||
|
Loss on debt extinguishment |
— |
308 |
||
|
MCS asset impairment and inventory write-down |
515 |
— |
||
|
Other, net |
92 |
161 |
||
|
Change in operating assets and liabilities, net of acquisitions and divestitures: |
||||
|
Accounts receivable, net |
(212) |
(450) |
||
|
Inventories |
(359) |
(75) |
||
|
Accounts payable and accrued liabilities |
6 |
529 |
||
|
Other operating assets and liabilities |
(444) |
(430) |
||
|
Net cash provided by operating activities |
5,289 |
4,495 |
||
|
Investing Activities: |
||||
|
Acquisitions, net of cash acquired |
(91) |
(976) |
||
|
Additions to property, plant, and equipment |
(979) |
(978) |
||
|
Purchases of investments |
(7,919) |
(9,448) |
||
|
Sales and maturities of investments |
7,130 |
6,753 |
||
|
Other investing activities, net |
(71) |
(136) |
||
|
Net cash used in investing activities |
(1,930) |
(4,785) |
||
|
Financing Activities: |
||||
|
Change in current debt obligations, net |
— |
(311) |
||
|
Proceeds from short-term borrowings (maturities greater than 90 days) |
— |
2,789 |
||
|
Issuance of long-term debt |
— |
7,172 |
||
|
Payments on long-term debt |
(1) |
(6,451) |
||
|
Dividends to shareholders |
(2,540) |
(2,339) |
||
|
Issuance of ordinary shares |
344 |
314 |
||
|
Repurchase of ordinary shares |
(1,138) |
(77) |
||
|
Other financing activities |
(52) |
(104) |
||
|
Net cash provided by (used in) financing activities |
(3,387) |
993 |
||
|
Effect of exchange rate changes on cash and cash equivalents |
(87) |
234 |
||
|
Net change in cash and cash equivalents |
(114) |
937 |
||
|
Cash and cash equivalents at beginning of period |
3,593 |
4,140 |
||
|
Cash and cash equivalents at end of period |
$ 3,479 |
$ 5,077 |
||
|
Supplemental Cash Flow Information |
||||
|
Cash paid for: |
||||
|
Income taxes |
$ 842 |
$ 813 |
||
|
Interest |
295 |
334 |
||
|
The data in this schedule has been intentionally rounded to the nearest million, and, therefore, may not sum. |
About Medtronic
Bold thinking. Bolder actions. We are Medtronic. Medtronic plc, headquartered in Dublin, Ireland, is the leading global healthcare technology company that boldly attacks the most challenging health problems facing humanity by searching out and finding solutions. Our Mission — to alleviate pain, restore health, and extend life — unites a global team of 90,000+ passionate people across 150 countries. Our technologies and therapies treat 70 health conditions and include cardiac devices, surgical robotics, insulin pumps, surgical tools, patient monitoring systems, and more. Powered by our diverse knowledge, insatiable curiosity, and desire to help all those who need it, we deliver innovative technologies that transform the lives of two people every second, every hour, every day. Expect more from us as we empower insight-driven care, experiences that put people first, and better outcomes for our world. In everything we do, we are engineering the extraordinary. For more information on Medtronic (NYSE:MDT), visit www.Medtronic.com and follow @Medtronic on Twitter and LinkedIn.
FORWARD LOOKING STATEMENTS
This press release contains forward-looking statements within the meaning of the Private Securities Litigation Reform Act of 1995, which are subject to risks and uncertainties, including risks related to competitive factors, difficulties and delays inherent in the development, manufacturing, marketing and sale of medical products, government regulation and general economic conditions and other risks and uncertainties described in the company's periodic reports on file with the U.S. Securities and Exchange Commission including the most recent Annual Report on Form 10-K of the company, as filed with the U.S. Securities and Exchange Commission. In some cases, you can identify these statements by forward-looking words or expressions, such as "anticipate," "believe," "could," "estimate," "expect," "forecast," "intend," "looking ahead," "may," "plan," "possible," "potential," "project," "should," "going to," "will," and similar words or expressions, the negative or plural of such words or expressions and other comparable terminology. Actual results may differ materially from anticipated results. Medtronic does not undertake to update its forward-looking statements or any of the information contained in this press release, including to reflect future events or circumstances.
NON-GAAP FINANCIAL MEASURES
This press release contains financial measures, including adjusted net income, adjusted diluted EPS, and organic revenue, which are considered "non-GAAP" financial measures under applicable SEC rules and regulations. References to quarterly figures increasing, decreasing or remaining flat are in comparison to the third quarter of fiscal year 2021.
Medtronic management believes that non-GAAP financial measures provide information useful to investors in understanding the company's underlying operational performance and trends and to facilitate comparisons with the performance of other companies in the med tech industry. Non-GAAP net income and diluted EPS exclude the effect of certain charges or gains that contribute to or reduce earnings but that result from transactions or events that management believes may or may not recur with similar materiality or impact to operations in future periods (Non-GAAP Adjustments). Medtronic generally uses non-GAAP financial measures to facilitate management's review of the operational performance of the company and as a basis for strategic planning. Non-GAAP financial measures should be considered supplemental to and not a substitute for financial information prepared in accordance with U.S. generally accepted accounting principles (GAAP), and investors are cautioned that Medtronic may calculate non-GAAP financial measures in a way that is different from other companies. Management strongly encourages investors to review the company's consolidated financial statements and publicly filed reports in their entirety. Reconciliations of the non-GAAP financial measures to the most directly comparable GAAP financial measures are included in the financial schedules accompanying this press release.
Medtronic calculates forward-looking non-GAAP financial measures based on internal forecasts that omit certain amounts that would be included in GAAP financial measures. For instance, forward-looking organic revenue growth guidance excludes the impact of foreign currency fluctuations, as well as significant acquisitions or divestitures. Forward-looking diluted non-GAAP EPS guidance also excludes other potential charges or gains that would be recorded as Non-GAAP Adjustments to earnings during the fiscal year. Medtronic does not attempt to provide reconciliations of forward-looking non-GAAP EPS guidance to projected GAAP EPS guidance because the combined impact and timing of recognition of these potential charges or gains is inherently uncertain and difficult to predict and is unavailable without unreasonable efforts. In addition, the company believes such reconciliations would imply a degree of precision and certainty that could be confusing to investors. Such items could have a substantial impact on GAAP measures of financial performance.
|
Contacts: |
|
|
Erika Winkels |
Ryan Weispfenning |
|
Public Relations |
Investor Relations |
|
+1-763-526-8478 |
+1-763-505-4626 |

![]()
SOURCE Medtronic plc

