
Medtronic Reports First Quarter Fiscal 2022 Financial Results


Medtronic plc (NYSE:MDT) today announced financial results for its first quarter of fiscal year 2022, which ended July 30, 2021. Key Highlights Revenue of $8.0 Billion Increased 23% Reported and...
DUBLIN, Aug. 24, 2021 /PRNewswire/ -- Medtronic plc (NYSE:MDT) today announced financial results for its first quarter of fiscal year 2022, which ended July 30, 2021.

Key Highlights
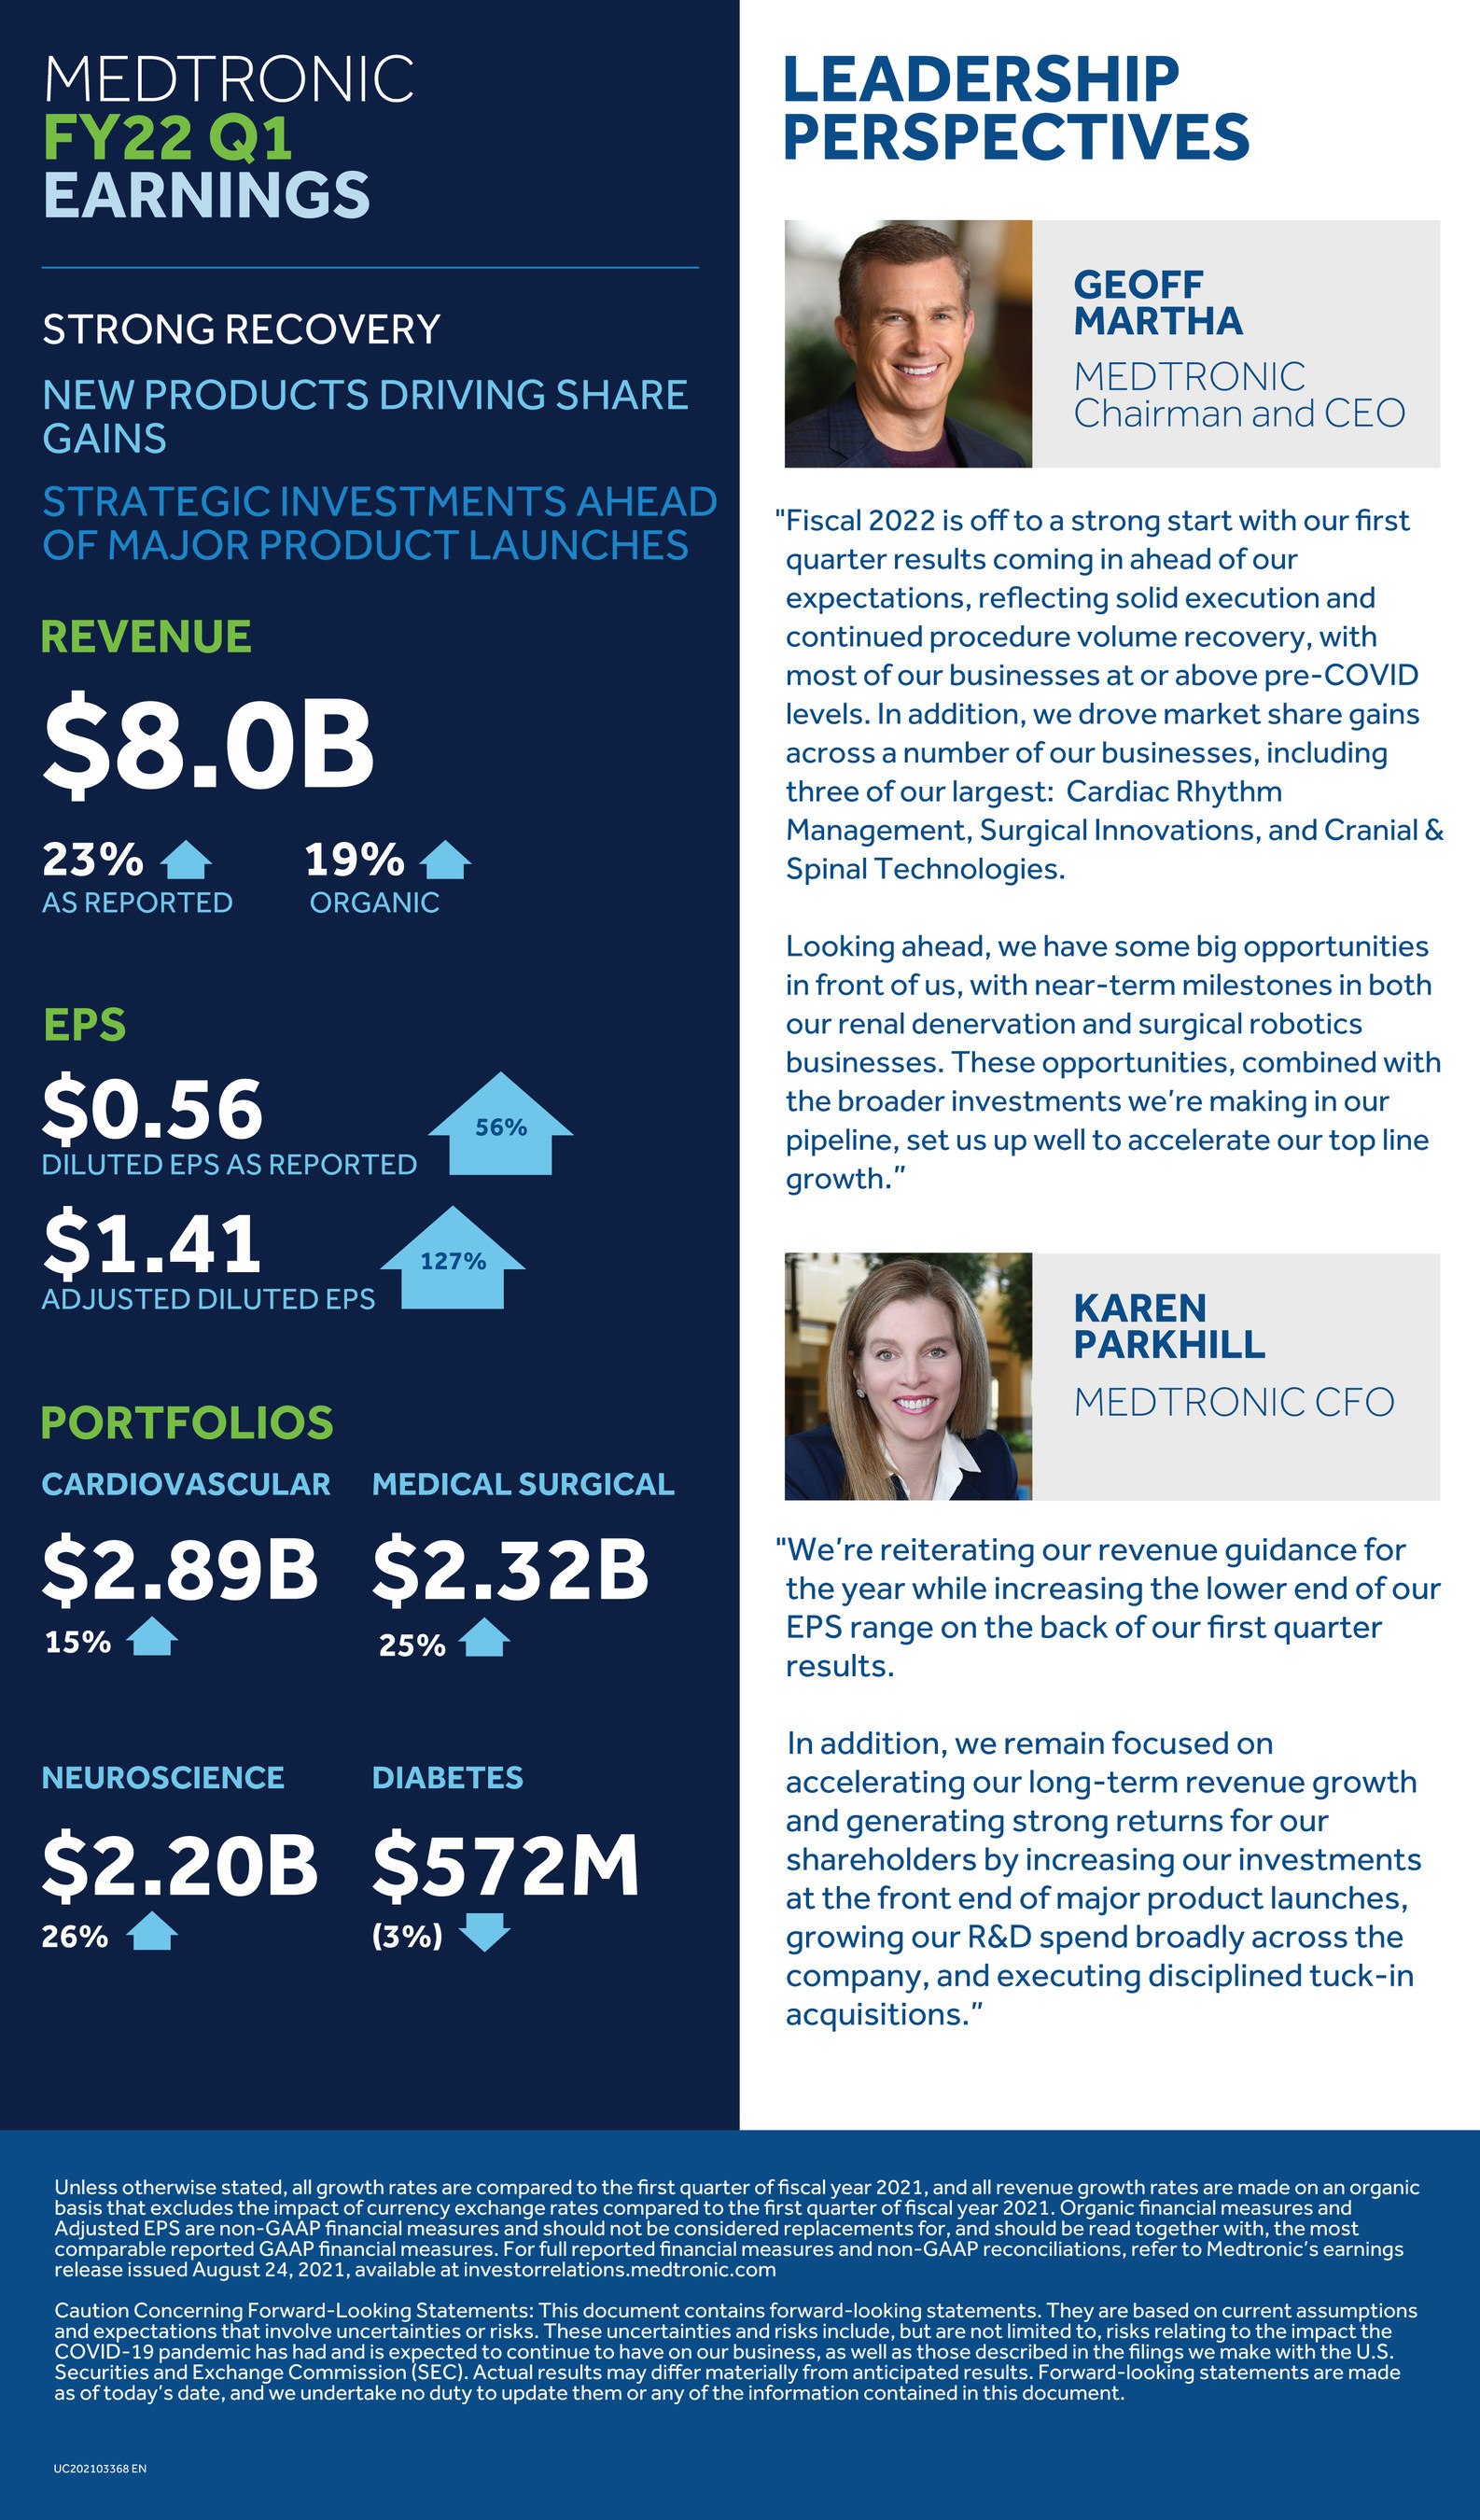
- Revenue of $8.0 Billion Increased 23% Reported and 19% Organic
- GAAP Diluted EPS of $0.56; Non-GAAP Diluted EPS of $1.41
- Company Reiterates FY22 Revenue Guidance; Raises Lower End of FY22 EPS Guidance by 5 cents
"FY22 is off to a strong start - Q1 reflects solid execution & continued procedure recovery"
Chairman & CEO Geoff Martha
The company reported first quarter worldwide revenue of $7.987 billion, an increase of 23% as reported and 19% on an organic basis, which excludes the $245 million benefit of foreign currency translation. Revenue growth rates have not been adjusted for the negative impact of the extra selling week in the first quarter of last fiscal year. The company's first quarter results reflect a strong recovery from the impact of the COVID-19 pandemic on elective procedures that the company experienced in 2020. Unless otherwise stated, all revenue growth rates in this press release are stated on an organic basis, which excludes the impact of foreign currency translation.
As reported, first quarter GAAP net income and diluted earnings per share (EPS) were $763 million and $0.56, respectively, increases of 57% and 56%, respectively. As detailed in the financial schedules included at the end of this release, first quarter non-GAAP net income and non-GAAP diluted EPS were $1.908 billion and $1.41, respectively, increases of 128% and 127%, respectively.
First quarter U.S. revenue of $4.101 billion represented 51% of company revenue and increased 22%. Non-U.S. developed market revenue of $2.601 billion represented 33% of company revenue and increased 20% as reported and 11% organic. Emerging Markets revenue of $1.286 billion represented 16% of company revenue and increased 31% as reported and 25% organic.
"Fiscal 2022 is off to a strong start with our first quarter results coming in ahead of our expectations, reflecting solid execution and continued procedure volume recovery, with most of our businesses at or above pre-COVID levels," said Geoff Martha, Medtronic chairman and chief executive officer. "In addition, we drove market share gains across a number of our businesses, including three of our largest: Cardiac Rhythm Management, Surgical Innovations, and Cranial & Spinal Technologies. Looking ahead, we have some big opportunities in front of us, with near-term milestones in both our renal denervation and surgical robotics businesses. These opportunities, combined with the broader investments we're making in our pipeline, set us up well to accelerate our top line growth."
Cardiovascular Portfolio
The Cardiovascular Portfolio includes the Cardiac Rhythm & Heart Failure (CRHF), Structural Heart & Aortic (SHA), and Coronary & Peripheral Vascular (CPV) divisions. Cardiovascular first quarter revenue of $2.890 billion increased 19% as reported and 15% organic, driven by low-twenties organic growth in SHA, mid-teens organic growth in CRHF, and high-single digit growth in CPV.
- Cardiac Rhythm & Heart Failure first quarter revenue of $1.483 billion increased 19% as reported and 15% organic. Adjusting for the discontinuation of HVAD™ System sales, CRHF revenue increased 19% organic. Cardiac Rhythm Management revenue increased in the high-teens, driven by low-double digit growth in Defibrillation Solutions and low-twenties growth in Cardiac Pacing Therapies, including low-thirties growth in Leadless Pacemakers on the continued global adoption of the Micra™ transcatheter pacing system. Cardiac Ablation Solutions revenue increased in the low-thirties on strong adoption of Arctic Front Advance™ cryoballoon catheters and consoles. Cardiovascular Diagnostics revenue grew in the low-double digits.
- Structural Heart & Aortic first quarter revenue of $787 million increased 26% as reported and 21% organic. Structural Heart grew in the high-thirties, driven by mid-thirties growth in transcatheter aortic valves (TAVR), including high-forties TAVR growth in the United States. Cardiac Surgery increased in the high-teens. Aortic declined in the low-single digits, as the financial impact of the previously announced global recall of the Valiant Navion™ thoracic stent graft system offset low-twenties growth in abdominal aortic aneurysm (AAA) stent grafts.
- Coronary & Peripheral Vascular first quarter revenue of $620 million increased 11% as reported and 7% organic. Coronary & Renal Denervation (CRDN) declined in the low-single digits, given the impact of previously announced coronary tenders in China. Excluding China, CRDN revenue grew in the high-single digits. Peripheral Vascular Health increased in the low-twenties, with mid-teens growth in IN.PACT™ drug-coated balloons and mid-fifties endoVenous growth on strong sales of VenaSeal™ and ClosureFast™ superficial vein products and Abre™ venous stents.
Medical Surgical Portfolio
The Medical Surgical Portfolio includes the Surgical Innovations (SI) and the Respiratory, Gastrointestinal & Renal (RGR) divisions. Medical Surgical first quarter revenue of $2.322 billion increased 29% as reported and 25% organic, with high-thirties organic growth in SI and mid-single digit organic growth in RGR.
- Surgical Innovations first quarter revenue of $1.554 billion increased 44% as reported and 39% organic. The division had low-forties growth in Vessel Sealing and high-thirties growth in Advanced Stapling, driven by the continued adoption of the company's LigaSure™, Sonicision™, and Tri-Staple™ technologies. Hernia & Wound Management increased in the mid-thirties, with strength in sutures and hernia product lines.
- Respiratory, Gastrointestinal & Renal first quarter revenue of $768 million increased 7% as reported and 3% organic. Patient Monitoring increased in the mid-twenties, with mid-thirties growth in the company's Nellcor™ pulse oximetry products. Respiratory Interventions decreased in the mid-twenties, with sales of ventilators declining in the low-forties as demand returns to pre-pandemic levels. Gastrointestinal revenue increased in the high-twenties on low-fifties growth in Esophageal & Gastric. Renal Care Solutions increased in the mid-single digits with strong growth in acute therapies.
Neuroscience Portfolio
The Neuroscience Portfolio includes the Cranial & Spinal Technologies (CST), Specialty Therapies, and Neuromodulation divisions. Neuroscience first quarter revenue of $2.204 billion increased 29% as reported and 26% organic, with high-thirties growth in Neuromodulation and Specialty Therapies and high-teens growth in CST, all on an organic basis.
- Cranial & Spinal Technologies first quarter revenue of $1.123 billion increased 19% as reported and 17% organic. Spine & Biologics grew in the low-double digits and Neurosurgery increased in the low-twenties, as spine surgeons continue to adopt the Medtronic ecosystem of spine implants and enabling technology, including Mazor™ robotics, StealthStation™ navigation, O-arm™ imaging, and Midas Rex™ powered surgical instruments.
- Specialty Therapies first quarter revenue of $641 million increased 42% as reported and 37% organic. Neurovascular increased in the high-single digits and ENT increased in the mid-thirties. Pelvic Health increased 134%, driven by continued strong adoption of the InterStim™ Micro sacral neuromodulation system.
- Neuromodulation first quarter revenue of $440 million increased 40% as reported and 37% organic. Brain Modulation increased in the high-thirties, driven by the launch of the Percept™ PC deep brain stimulation system. Pain Therapies increased in the low-forties, with Targeted Drug Delivery revenue more than doubling on the backlog recovery of replacement procedures, and Pain Stim revenue growing in the mid-twenties on strong uptake of Intellis™ with DTM™ SCS therapy. Interventional grew in the low-twenties.
Diabetes
Diabetes first quarter revenue of $572 million increased 2% as reported and declined 3% organic. Diabetes quarterly revenue performance was driven by high-single digit growth in durable pumps, including strong growth in international markets on the continued launch of the MiniMed™ 780G system. This was offset by mid-teens declines in U.S. sales of consumables and continuous glucose monitoring (CGM) products.
Guidance
The company today reiterated its revenue growth guidance and raised the lower end of its EPS guidance range for fiscal year 2022.
The company continues to expect revenue growth in its fiscal year 2022 to approximate 9% on an organic basis. If current exchange rates hold, revenue growth in fiscal year 2022 would be positively affected by approximately $100 to $200 million.
The company increased its fiscal year 2022 diluted non-GAAP EPS guidance from the prior range of $5.60 to $5.75 to the new range of $5.65 to $5.75, including an estimated 5 to 10 cent positive impact from foreign currency exchange versus a 10 to 15 cent positive impact previously.
"We're reiterating our revenue guidance for the year while increasing the lower end of our EPS range on the back of our first quarter results," said Karen Parkhill, Medtronic chief financial officer. "We remain focused on accelerating our long-term revenue growth and generating strong returns for our shareholders. In addition to growing our dividend, we are increasing our investments at the front end of major product launches, growing our R&D spend broadly across the company, and executing disciplined tuck-in acquisitions."
Webcast Information
Medtronic will host a webcast today, August 24, at 8:00 a.m. EDT (7:00 a.m. CDT) to provide information about its businesses for the public, investors, analysts, and news media. This webcast can be accessed by clicking on the Investor Events link at investorrelations.medtronic.com and this earnings release will be archived at news.medtronic.com. Medtronic will be live tweeting during the webcast on its Newsroom Twitter account, @Medtronic. Within 24 hours of the webcast, a replay of the webcast and transcript of the company's prepared remarks will be available by clicking on the Investor Events link at investorrelations.medtronic.com.
Medtronic plans to report its fiscal year 2022 second, third, and fourth quarter results on November 23, 2021, February 22, 2022, and May 26, 2022, respectively. Confirmation and additional details will be provided closer to the specific event.
Financial Schedules
The first quarter financial schedules and non-GAAP reconciliations can be viewed below. To view a printable PDF of the financial schedules and non-GAAP reconciliations, click here. To view the first quarter earnings presentation, click here.
|
MEDTRONIC PLC WORLD WIDE REVENUE(1) (Unaudited) |
|||||||||||||||||||||
|
FIRST QUARTER(2) |
|||||||||||||||||||||
|
REPORTED |
CONSTANT CURRENCY |
||||||||||||||||||||
|
(in millions) |
FY22 |
FY21 |
Growth |
Currency |
FY22 |
Growth |
|||||||||||||||
|
Cardiovascular(3) |
$ |
2,890 |
$ |
2,433 |
18.8 |
% |
$ |
96 |
$ |
2,794 |
14.8 |
% |
|||||||||
|
Cardiac Rhythm & Heart Failure |
1,483 |
1,247 |
18.9 |
46 |
1,437 |
15.2 |
|||||||||||||||
|
Structural Heart & Aortic |
787 |
627 |
25.5 |
28 |
759 |
21.1 |
|||||||||||||||
|
Coronary & Peripheral Vascular |
620 |
558 |
11.1 |
22 |
598 |
7.2 |
|||||||||||||||
|
Medical Surgical |
2,322 |
1,801 |
28.9 |
77 |
2,245 |
24.7 |
|||||||||||||||
|
Surgical Innovations |
1,554 |
1,080 |
43.9 |
54 |
1,500 |
38.9 |
|||||||||||||||
|
Respiratory, Gastrointestinal, & Renal |
768 |
720 |
6.7 |
23 |
745 |
3.5 |
|||||||||||||||
|
Neuroscience |
2,204 |
1,712 |
28.7 |
47 |
2,157 |
26.0 |
|||||||||||||||
|
Cranial & Spinal Technologies |
1,123 |
944 |
19.0 |
19 |
1,104 |
16.9 |
|||||||||||||||
|
Specialty Therapies |
641 |
453 |
41.5 |
19 |
622 |
37.3 |
|||||||||||||||
|
Neuromodulation |
440 |
314 |
40.1 |
10 |
430 |
36.9 |
|||||||||||||||
|
Diabetes |
572 |
562 |
1.8 |
26 |
546 |
(2.8) |
|||||||||||||||
|
TOTAL |
$ |
7,987 |
$ |
6,507 |
22.7 |
% |
$ |
245 |
$ |
7,742 |
19.0 |
% |
|||||||||
|
(1) The data in this schedule has been intentionally rounded to the nearest million and, therefore, may not sum. |
|
(2) Fiscal year 2021 was a 53-week fiscal year, with the extra week occurring in the first fiscal month of the first quarter. While it is difficult to calculate the impact of the extra week, the Company estimates the extra week benefited the first quarter of fiscal year 2021 revenue by approximately $360 to $390 million. |
|
(3) In the fourth quarter of fiscal year 2021, the Company realigned its divisions within Cardiovascular. As a result, fiscal year 2021 results have been recast to adjust for this realignment. |
|
(4) The currency impact to revenue measures the change in revenue between current and prior year periods using constant exchange rates. |
|
MEDTRONIC PLC U.S.(1)(2) REVENUE (Unaudited) |
||||||||||
|
FIRST QUARTER |
||||||||||
|
REPORTED |
||||||||||
|
(in millions) |
FY22 |
FY21 |
Growth |
|||||||
|
Cardiovascular(3) |
$ |
1,420 |
$ |
1,206 |
17.7 |
% |
||||
|
Cardiac Rhythm & Heart Failure |
770 |
672 |
14.6 |
|||||||
|
Structural Heart & Aortic |
347 |
274 |
26.6 |
|||||||
|
Coronary & Peripheral Vascular |
303 |
260 |
16.5 |
|||||||
|
Medical Surgical |
990 |
722 |
37.1 |
|||||||
|
Surgical Innovations |
620 |
400 |
55.0 |
|||||||
|
Respiratory, Gastrointestinal, & Renal |
370 |
322 |
14.9 |
|||||||
|
Neuroscience |
1,446 |
1,136 |
27.3 |
|||||||
|
Cranial & Spinal Technologies |
795 |
692 |
14.9 |
|||||||
|
Specialty Therapies |
360 |
242 |
48.8 |
|||||||
|
Neuromodulation |
291 |
202 |
44.1 |
|||||||
|
Diabetes |
245 |
287 |
(14.6) |
|||||||
|
TOTAL |
$ |
4,101 |
$ |
3,351 |
22.4 |
% |
||||
|
(1) U.S. includes the United States and U.S. territories. |
|
(2) The data in this schedule has been intentionally rounded to the nearest million and, therefore, may not sum. |
|
(3) In the fourth quarter of fiscal year 2021, the Company realigned its divisions within Cardiovascular. As a result, fiscal year 2021 results have been recast to adjust for this realignment. |
|
MEDTRONIC PLC WORLD WIDE REVENUE: GEOGRAPHIC (1)(2) (Unaudited) |
|||||||||||||||||||||
|
FIRST QUARTER(3) |
|||||||||||||||||||||
|
REPORTED |
CONSTANT CURRENCY |
||||||||||||||||||||
|
(in millions) |
FY22 |
FY21 |
Growth |
Currency |
FY22 |
Growth |
|||||||||||||||
|
U.S. |
$ |
1,420 |
$ |
1,206 |
17.7 |
% |
$ |
— |
$ |
1,420 |
17.7 |
% |
|||||||||
|
Non-U.S. Developed |
1,003 |
853 |
17.6 |
72 |
931 |
9.1 |
|||||||||||||||
|
Emerging Markets |
467 |
374 |
24.9 |
24 |
443 |
18.4 |
|||||||||||||||
|
Cardiovascular |
2,890 |
2,433 |
18.8 |
96 |
2,794 |
14.8 |
|||||||||||||||
|
U.S. |
990 |
722 |
37.1 |
— |
990 |
37.1 |
|||||||||||||||
|
Non-U.S. Developed |
869 |
719 |
20.9 |
57 |
812 |
12.9 |
|||||||||||||||
|
Emerging Markets |
463 |
359 |
29.0 |
19 |
444 |
23.7 |
|||||||||||||||
|
Medical Surgical |
2,322 |
1,801 |
28.9 |
77 |
2,245 |
24.7 |
|||||||||||||||
|
U.S. |
1,446 |
1,136 |
27.3 |
— |
1,446 |
27.3 |
|||||||||||||||
|
Non-U.S. Developed |
465 |
376 |
23.7 |
30 |
435 |
15.7 |
|||||||||||||||
|
Emerging Markets |
293 |
199 |
47.2 |
17 |
276 |
38.7 |
|||||||||||||||
|
Neuroscience |
2,204 |
1,712 |
28.7 |
47 |
2,157 |
26.0 |
|||||||||||||||
|
U.S. |
245 |
287 |
(14.6) |
— |
245 |
(14.6) |
|||||||||||||||
|
Non-U.S. Developed |
263 |
226 |
16.4 |
23 |
240 |
6.2 |
|||||||||||||||
|
Emerging Markets |
63 |
48 |
31.3 |
3 |
60 |
25.0 |
|||||||||||||||
|
Diabetes |
572 |
562 |
1.8 |
26 |
546 |
(2.8) |
|||||||||||||||
|
U.S. |
4,101 |
3,351 |
22.4 |
— |
4,101 |
22.4 |
|||||||||||||||
|
Non-U.S. Developed |
2,601 |
2,175 |
19.6 |
182 |
2,419 |
11.2 |
|||||||||||||||
|
Emerging Markets |
1,286 |
981 |
31.1 |
63 |
1,223 |
24.7 |
|||||||||||||||
|
TOTAL |
$ |
7,987 |
$ |
6,507 |
22.7 |
% |
$ |
245 |
$ |
7,742 |
19.0 |
% |
|||||||||
|
(1) U.S. includes the United States and U.S. territories. Non-U.S. developed markets include Japan, Australia, New Zealand, Korea, Canada, and the countries of Western Europe. Emerging Markets include the countries of the Middle East, Africa, Latin America, Eastern Europe, and the countries of Asia that are not included in the non-U.S. developed markets, as previously defined. |
|
(2) The data in this schedule has been intentionally rounded to the nearest million and, therefore, may not sum. |
|
(3) Fiscal year 2021 was a 53-week fiscal year, with the extra week occurring in the first fiscal month of the first quarter. While it is difficult to calculate the impact of the extra week, the Company estimates the extra week benefited the first quarter of fiscal year 2021 revenue by approximately $360 to $390 million. |
|
(4) The currency impact to revenue measures the change in revenue between current and prior year periods using constant exchange rates. |
|
MEDTRONIC PLC CONSOLIDATED STATEMENTS OF INCOME (Unaudited) |
|||||||
|
Three months ended |
|||||||
|
(in millions, except per share data) |
July 30, 2021 |
July 31, 2020 |
|||||
|
Net sales |
$ |
7,987 |
$ |
6,507 |
|||
|
Costs and expenses: |
|||||||
|
Cost of products sold |
2,598 |
2,505 |
|||||
|
Research and development expense |
750 |
621 |
|||||
|
Selling, general, and administrative expense |
2,547 |
2,417 |
|||||
|
Amortization of intangible assets |
436 |
440 |
|||||
|
Restructuring charges, net |
11 |
53 |
|||||
|
Certain litigation charges, net |
26 |
(88) |
|||||
|
Other operating expense (income), net |
760 |
(114) |
|||||
|
Operating profit |
859 |
673 |
|||||
|
Other non-operating income, net |
(111) |
(82) |
|||||
|
Interest expense |
137 |
171 |
|||||
|
Income before income taxes |
833 |
584 |
|||||
|
Income tax provision |
64 |
93 |
|||||
|
Net income |
769 |
491 |
|||||
|
Net income attributable to noncontrolling interests |
(6) |
(4) |
|||||
|
Net income attributable to Medtronic |
$ |
763 |
$ |
487 |
|||
|
Basic earnings per share |
$ |
0.57 |
$ |
0.36 |
|||
|
Diluted earnings per share |
$ |
0.56 |
$ |
0.36 |
|||
|
Basic weighted average shares outstanding |
1,344.5 |
1,341.9 |
|||||
|
Diluted weighted average shares outstanding |
1,356.4 |
1,350.0 |
|||||
|
The data in this schedule has been intentionally rounded to the nearest million, and, therefore, may not sum. |
|
MEDTRONIC PLC GAAP TO NON-GAAP RECONCILIATIONS(1) (Unaudited) |
||||||||||||||||||||||||||||||||
|
Three months ended July 30, 2021 |
||||||||||||||||||||||||||||||||
|
(in millions, except per share data) |
Net |
Cost of |
Gross |
Operating |
Operating |
Income |
Net Income |
Diluted |
Effective |
|||||||||||||||||||||||
|
GAAP |
$ |
7,987 |
$ |
2,598 |
67.5 |
% |
$ |
859 |
10.8 |
% |
$ |
833 |
$ |
763 |
$ |
0.56 |
7.7 |
% |
||||||||||||||
|
Non-GAAP Adjustments: |
||||||||||||||||||||||||||||||||
|
Restructuring and associated costs (2) |
— |
(33) |
0.4 |
81 |
1.0 |
81 |
65 |
0.05 |
21.0 |
|||||||||||||||||||||||
|
Acquisition-related items (3) |
— |
(5) |
0.1 |
109 |
1.4 |
109 |
87 |
0.06 |
20.2 |
|||||||||||||||||||||||
|
Certain litigation charges |
— |
— |
— |
26 |
0.3 |
26 |
21 |
0.02 |
19.2 |
|||||||||||||||||||||||
|
(Gain)/loss on minority investments (4) |
— |
— |
— |
— |
— |
(31) |
(29) |
(0.02) |
— |
|||||||||||||||||||||||
|
Medical device regulations (5) |
— |
(11) |
0.1 |
21 |
0.3 |
21 |
17 |
0.01 |
19.0 |
|||||||||||||||||||||||
|
Amortization of intangible assets |
— |
— |
— |
436 |
5.5 |
436 |
366 |
0.27 |
15.8 |
|||||||||||||||||||||||
|
MCS impairments / costs (6) |
— |
(58) |
0.7 |
726 |
9.1 |
726 |
564 |
0.42 |
22.3 |
|||||||||||||||||||||||
|
Certain tax adjustments, net (7) |
— |
— |
— |
— |
— |
— |
53 |
0.04 |
— |
|||||||||||||||||||||||
|
Non-GAAP |
$ |
7,987 |
$ |
2,491 |
68.8 |
% |
$ |
2,258 |
28.3 |
% |
$ |
2,201 |
$ |
1,908 |
$ |
1.41 |
13.2 |
% |
||||||||||||||
|
Currency impact |
(245) |
(56) |
(0.3) |
(47) |
0.3 |
(0.03) |
||||||||||||||||||||||||||
|
Currency Adjusted |
$ |
7,742 |
$ |
2,435 |
68.5 |
% |
$ |
2,211 |
28.6 |
% |
$ |
1.38 |
||||||||||||||||||||
|
Three months ended July 31, 2020 |
||||||||||||||||||||||||||||||||
|
(in millions, except per share data) |
Net |
Cost of |
Gross |
Operating |
Operating |
Income |
Net Income |
Diluted |
Effective |
|||||||||||||||||||||||
|
GAAP |
$ |
6,507 |
$ |
2,505 |
61.5 |
% |
$ |
673 |
10.3 |
% |
$ |
584 |
$ |
487 |
$ |
0.36 |
15.9 |
% |
||||||||||||||
|
Non-GAAP Adjustments: |
||||||||||||||||||||||||||||||||
|
Restructuring and associated costs (2) |
— |
(27) |
0.4 |
128 |
2.0 |
128 |
106 |
0.08 |
17.2 |
|||||||||||||||||||||||
|
Acquisition-related items (8) |
— |
(2) |
— |
(95) |
(1.5) |
(95) |
(67) |
(0.05) |
29.5 |
|||||||||||||||||||||||
|
Certain litigation charges |
— |
— |
— |
(88) |
(1.4) |
(88) |
(70) |
(0.05) |
20.5 |
|||||||||||||||||||||||
|
(Gain)/loss on minority investments (4) |
— |
— |
— |
— |
— |
(10) |
(10) |
(0.01) |
— |
|||||||||||||||||||||||
|
Medical device regulations (5) |
— |
(10) |
0.2 |
18 |
0.3 |
18 |
16 |
0.01 |
11.1 |
|||||||||||||||||||||||
|
Amortization of intangible assets |
— |
— |
— |
440 |
6.8 |
440 |
370 |
0.27 |
15.9 |
|||||||||||||||||||||||
|
Certain tax adjustments, net |
— |
— |
— |
— |
— |
— |
4 |
— |
— |
|||||||||||||||||||||||
|
Non-GAAP |
$ |
6,507 |
$ |
2,466 |
62.1 |
% |
$ |
1,076 |
16.5 |
% |
$ |
977 |
$ |
836 |
$ |
0.62 |
14.0 |
% |
||||||||||||||
|
See description of non-GAAP financial measures at the end of the earnings press release. |
|
(1) The data in this schedule has been intentionally rounded to the nearest million or $0.01 for EPS figures, and, therefore, may not sum. |
|
(2) Associated costs include costs incurred as a direct result of the restructuring program, such as salaries for employees supporting the program and consulting expenses. |
|
(3) The charges primarily include acquisitions of, and certain license payments for, unapproved technology, business combination costs, and changes in fair value of contingent consideration. |
|
(4) We exclude unrealized and realized gains and losses on our minority investments as we do not believe that these components of income or expense have a direct correlation to our ongoing or future business operations. |
|
(5) The charges represent incremental costs of complying with the new European Union medical device regulations for previously registered products and primarily include charges for contractors supporting the project and other direct third-party expenses. |
|
(6) The charges relate to the Company's June 3, 2021 decision to stop the distribution and sale of the Medtronic HVAD System within the Mechanical Circulatory Support Operating Unit (MCS). Medtronic is committed to serving the needs of the approximately 4,000 patients currently implanted with the HVAD System. The charges include $515 million of non-cash impairments, primarily related to $409 million of intangible asset impairments, as well as $211 million for commitments and obligations in connection with our decision, including customer support obligations, restructuring, and other associated costs. |
|
(7) The charges are associated with a change in the company's permanently reinvestment assertion on certain historical earnings and the amortization on previously established deferred tax assets from intercompany intellectual property transactions. |
|
(8) The charges primarily include business combination costs, certain license payments for unapproved technology, changes in fair value of contingent consideration, and a change in amounts accrued for certain contingent liabilities for recent acquisitions. |
|
MEDTRONIC PLC GAAP TO NON-GAAP RECONCILIATIONS(1) (Unaudited) |
||||||||||||||||||||||||||||
|
Three months ended July 30, 2021 |
||||||||||||||||||||||||||||
|
(in millions) |
Net Sales |
SG&A |
SG&A |
R&D |
R&D |
Other |
Other |
Other Non- |
||||||||||||||||||||
|
GAAP |
$ |
7,987 |
$ |
2,547 |
31.9 |
% |
$ |
750 |
9.4 |
% |
$ |
760 |
9.5 |
% |
$ |
(111) |
||||||||||||
|
Non-GAAP Adjustments: |
||||||||||||||||||||||||||||
|
Restructuring and associated costs (2) |
— |
(37) |
(0.5) |
— |
— |
— |
— |
— |
||||||||||||||||||||
|
Acquisition-related items (3) |
— |
— |
— |
(90) |
(1.1) |
(14) |
(0.2) |
— |
||||||||||||||||||||
|
Medical device regulations (4) |
— |
— |
— |
(9) |
(0.1) |
— |
— |
— |
||||||||||||||||||||
|
MCS impairments / costs (5) |
— |
— |
— |
— |
— |
(668) |
(8.4) |
— |
||||||||||||||||||||
|
Gain/(loss) on minority investments (6) |
— |
— |
— |
— |
— |
— |
— |
31 |
||||||||||||||||||||
|
Non-GAAP |
$ |
7,987 |
$ |
2,510 |
31.4 |
% |
$ |
651 |
8.2 |
% |
$ |
78 |
1.0 |
% |
$ |
(80) |
||||||||||||
|
Currency impact |
(245) |
(69) |
0.1 |
(7) |
0.1 |
(66) |
(0.8) |
1 |
||||||||||||||||||||
|
Currency Adjusted |
$ |
7,742 |
$ |
2,440 |
31.5 |
% |
$ |
644 |
8.3 |
% |
$ |
12 |
0.2 |
% |
$ |
(79) |
||||||||||||
|
See description of non-GAAP financial measures at the end of the earnings press release. |
|
(1) The data in this schedule has been intentionally rounded to the nearest million, and, therefore, may not sum. |
|
(2) Associated costs include costs incurred as a direct result of the restructuring program, such as salaries for employees supporting the program and consulting expenses. |
|
(3) The charges primarily include acquisitions of, and certain license payments for, unapproved technology, business combination costs, and changes in fair value of contingent consideration. |
|
(4) The charges represent incremental costs of complying with the new European Union medical device regulations for previously registered products and primarily include charges for contractors supporting the project and other direct third-party expenses. |
|
(5) The charges relate to the Company's June 3, 2021 decision to stop the distribution and sale of the Medtronic HVAD System within the Mechanical Circulatory Support Operating Unit (MCS). Medtronic is committed to serving the needs of the approximately 4,000 patients currently implanted with the HVAD System. The charges include $515 million of non-cash impairments, primarily related to $409 million of intangible asset impairments, as well as $211 million for commitments and obligations in connection with our decision, including customer support obligations, restructuring, and other associated costs. |
|
(6) We exclude unrealized and realized gains and losses on our minority investments as we do not believe that these components of income or expense have a direct correlation to our ongoing or future business operations. |
|
MEDTRONIC PLC GAAP TO NON-GAAP RECONCILIATIONS(1) (Unaudited) |
|||||||||||
|
Three months |
Three months |
Fiscal year |
|||||||||
|
(in millions) |
July 30, 2021 |
July 31, 2020 |
2021 |
||||||||
|
Net cash provided by operating activities |
$ |
1,292 |
$ |
278 |
$ |
6,240 |
|||||
|
Additions to property, plant, and equipment |
(378) |
(334) |
(1,355) |
||||||||
|
Free Cash Flow (2) |
$ |
914 |
$ |
(56) |
$ |
4,885 |
|||||
|
See description of non-GAAP financial measures at the end of the earnings press release. |
|
(1) The data in this schedule has been intentionally rounded to the nearest million, and, therefore, may not sum. |
|
(2) Free cash flow represents operating cash flows less property, plant, and equipment additions. |
|
MEDTRONIC PLC CONSOLIDATED BALANCE SHEETS (Unaudited) |
||||||||
|
(in millions) |
July 30, 2021 |
April 30, 2021 |
||||||
|
ASSETS |
||||||||
|
Current assets: |
||||||||
|
Cash and cash equivalents |
$ |
3,004 |
$ |
3,593 |
||||
|
Investments |
7,591 |
7,224 |
||||||
|
Accounts receivable, less allowances and credit losses of $257 and $241, respectively |
5,431 |
5,462 |
||||||
|
Inventories, net |
4,288 |
4,313 |
||||||
|
Other current assets |
2,120 |
1,955 |
||||||
|
Total current assets |
22,434 |
22,548 |
||||||
|
Property, plant, and equipment |
12,808 |
12,700 |
||||||
|
Accumulated depreciation |
(7,646) |
(7,479) |
||||||
|
Property, plant, and equipment, net |
5,162 |
5,221 |
||||||
|
Goodwill |
41,720 |
41,961 |
||||||
|
Other intangible assets, net |
16,890 |
17,740 |
||||||
|
Tax assets |
3,187 |
3,169 |
||||||
|
Other assets |
2,409 |
2,443 |
||||||
|
Total assets |
$ |
91,802 |
$ |
93,083 |
||||
|
LIABILITIES AND EQUITY |
||||||||
|
Current liabilities: |
||||||||
|
Current debt obligations |
$ |
6 |
$ |
11 |
||||
|
Accounts payable |
1,864 |
2,106 |
||||||
|
Accrued compensation |
1,901 |
2,482 |
||||||
|
Accrued income taxes |
341 |
435 |
||||||
|
Other accrued expenses |
3,652 |
3,475 |
||||||
|
Total current liabilities |
7,764 |
8,509 |
||||||
|
Long-term debt |
25,958 |
26,378 |
||||||
|
Accrued compensation and retirement benefits |
1,521 |
1,557 |
||||||
|
Accrued income taxes |
2,262 |
2,251 |
||||||
|
Deferred tax liabilities |
1,054 |
1,028 |
||||||
|
Other liabilities |
1,579 |
1,756 |
||||||
|
Total liabilities |
40,137 |
41,481 |
||||||
|
Commitments and contingencies |
||||||||
|
Shareholders' equity: |
||||||||
|
Ordinary shares— par value $0.0001, 2.6 billion shares authorized, 1,344,671,106 and |
— |
— |
||||||
|
Additional paid-in capital |
26,184 |
26,319 |
||||||
|
Retained earnings |
28,511 |
28,594 |
||||||
|
Accumulated other comprehensive loss |
(3,209) |
(3,485) |
||||||
|
Total shareholders' equity |
51,486 |
51,428 |
||||||
|
Noncontrolling interests |
178 |
174 |
||||||
|
Total equity |
51,664 |
51,602 |
||||||
|
Total liabilities and equity |
$ |
91,802 |
$ |
93,083 |
||||
|
The data in this schedule has been intentionally rounded to the nearest million, and, therefore, may not sum. |
|
MEDTRONIC PLC CONSOLIDATED STATEMENTS OF CASH FLOWS (Unaudited) |
||||||||
|
Three months ended |
||||||||
|
(in millions) |
July 30, 2021 |
July 31, 2020 |
||||||
|
Operating Activities: |
||||||||
|
Net income |
$ |
769 |
$ |
491 |
||||
|
Adjustments to reconcile net income to net cash provided by operating activities: |
||||||||
|
Depreciation and amortization |
671 |
669 |
||||||
|
Provision for doubtful accounts |
15 |
37 |
||||||
|
Deferred income taxes |
(11) |
3 |
||||||
|
Stock-based compensation |
69 |
70 |
||||||
|
MCS asset impairment and inventory write-down |
515 |
— |
||||||
|
Other, net |
116 |
68 |
||||||
|
Change in operating assets and liabilities, net of acquisitions and divestitures: |
||||||||
|
Accounts receivable, net |
(40) |
(142) |
||||||
|
Inventories |
(75) |
(235) |
||||||
|
Accounts payable and accrued liabilities |
(416) |
(541) |
||||||
|
Other operating assets and liabilities |
(321) |
(142) |
||||||
|
Net cash provided by operating activities |
1,292 |
278 |
||||||
|
Investing Activities: |
||||||||
|
Additions to property, plant, and equipment |
(378) |
(334) |
||||||
|
Purchases of investments |
(2,654) |
(2,045) |
||||||
|
Sales and maturities of investments |
2,324 |
2,403 |
||||||
|
Other investing activities, net |
(76) |
(16) |
||||||
|
Net cash provided by (used in) investing activities |
(784) |
8 |
||||||
|
Financing Activities: |
||||||||
|
Change in current debt obligations, net |
— |
(16) |
||||||
|
Proceeds from short-term borrowings (maturities greater than 90 days) |
— |
2,789 |
||||||
|
Payments on long-term debt |
(1) |
(11) |
||||||
|
Dividends to shareholders |
(846) |
(778) |
||||||
|
Issuance of ordinary shares |
111 |
26 |
||||||
|
Repurchase of ordinary shares |
(315) |
— |
||||||
|
Other financing activities |
(4) |
(51) |
||||||
|
Net cash provided by (used in) financing activities |
(1,055) |
1,959 |
||||||
|
Effect of exchange rate changes on cash and cash equivalents |
(42) |
114 |
||||||
|
Net change in cash and cash equivalents |
(589) |
2,359 |
||||||
|
Cash and cash equivalents at beginning of period |
3,593 |
4,140 |
||||||
|
Cash and cash equivalents at end of period |
$ |
3,004 |
$ |
6,499 |
||||
|
Supplemental Cash Flow Information |
||||||||
|
Cash paid for: |
||||||||
|
Income taxes |
$ |
249 |
$ |
72 |
||||
|
Interest |
63 |
72 |
||||||
|
The data in this schedule has been intentionally rounded to the nearest million, and, therefore, may not sum. |
About Medtronic
Medtronic plc (www.medtronic.com), headquartered in Dublin, Ireland, is among the world's largest medical technology, services and solutions companies – alleviating pain, restoring health and extending life for millions of people around the world. Medtronic employs more than 90,000 people worldwide, serving physicians, hospitals and patients in more than 150 countries. The company is focused on collaborating with stakeholders around the world to take healthcare Further, Together.
FORWARD LOOKING STATEMENTS
This press release contains forward-looking statements within the meaning of the Private Securities Litigation Reform Act of 1995, which are subject to risks and uncertainties, including risks related to competitive factors, difficulties and delays inherent in the development, manufacturing, marketing and sale of medical products, government regulation and general economic conditions and other risks and uncertainties described in the company's periodic reports on file with the U.S. Securities and Exchange Commission including the most recent Annual Report on Form 10-K of the company, as filed with the U.S. Securities and Exchange Commission. In some cases, you can identify these statements by forward-looking words or expressions, such as "anticipate," "believe," "could," "estimate," "expect," "forecast," "intend," "looking ahead," "may," "plan," "possible," "potential," "project," "should," "going to," "will," and similar words or expressions, the negative or plural of such words or expressions and other comparable terminology. Actual results may differ materially from anticipated results. Medtronic does not undertake to update its forward-looking statements or any of the information contained in this press release, including to reflect future events or circumstances.
NON-GAAP FINANCIAL MEASURES
This press release contains financial measures, including adjusted net income, adjusted diluted EPS, and organic revenue, which are considered "non-GAAP" financial measures under applicable SEC rules and regulations. References to quarterly figures increasing, decreasing or remaining flat are in comparison to fiscal year 2021.
Medtronic management believes that non-GAAP financial measures provide information useful to investors in understanding the company's underlying operational performance and trends and to facilitate comparisons with the performance of other companies in the med tech industry. Non-GAAP net income and diluted EPS exclude the effect of certain charges or gains that contribute to or reduce earnings but that result from transactions or events that management believes may or may not recur with similar materiality or impact to operations in future periods (Non-GAAP Adjustments). Medtronic generally uses non-GAAP financial measures to facilitate management's review of the operational performance of the company and as a basis for strategic planning. Non-GAAP financial measures should be considered supplemental to and not a substitute for financial information prepared in accordance with U.S. generally accepted accounting principles (GAAP), and investors are cautioned that Medtronic may calculate non-GAAP financial measures in a way that is different from other companies. Management strongly encourages investors to review the company's consolidated financial statements and publicly filed reports in their entirety. Reconciliations of the non-GAAP financial measures to the most directly comparable GAAP financial measures are included in the financial schedules accompanying this press release.
Medtronic calculates forward-looking non-GAAP financial measures based on internal forecasts that omit certain amounts that would be included in GAAP financial measures. For instance, forward-looking organic revenue growth guidance excludes the impact of foreign currency fluctuations, as well as significant acquisitions or divestitures. Forward-looking diluted non-GAAP EPS guidance also excludes other potential charges or gains that would be recorded as Non-GAAP Adjustments to earnings during the fiscal year. Medtronic does not attempt to provide reconciliations of forward-looking non-GAAP EPS guidance to projected GAAP EPS guidance because the combined impact and timing of recognition of these potential charges or gains is inherently uncertain and difficult to predict and is unavailable without unreasonable efforts. In addition, the company believes such reconciliations would imply a degree of precision and certainty that could be confusing to investors. Such items could have a substantial impact on GAAP measures of financial performance.
|
Contacts: |
|
|
Erika Winkels |
Ryan Weispfenning |
|
Public Relations |
Investor Relations |
|
+1-763-526-8478 |
+1-763-505-4626 |


![]()
SOURCE Medtronic plc

